Welcome to our Knowledge Base
-
System Settings
-
- Articles coming soon
-
- Upload Students (Video)
- Upload Students
- Manage Students
- Upload Student Pictures
- User Accounts
- Upload User Accounts
- User Permissions
- Mass Updates
- Manage Family and Guests
- Printer Setup - 3" Thermal (Windows)
- Printer Setup - 3" Thermal (Mac) **Advanced Setup**
- Printer Setup - 3" Thermal Network (Mac) **Advanced Setup**
- Preparing for Next School Year
- Microsoft Single Sign-On (SSO)
-
Store
-
- Articles coming soon
-
- Creating a Transaction
- Scanning a Student ID
- Student Credit
- Student Credit - Credit Refunds
- Product Buttons
- Returns
- Printing Receipts
- Payment Type
- Modify Transaction - Post Sale
- E-mail Receipts
- ProPay: How to Void a Transaction
- ProPay: How to Process Credit Cards
- Reprint Receipt and Resend Receipt by E-mail
- Exporting Ticket Sales from Store to Ticketing for Checkin
- Changing Payment Type After Transaction has Completed
- Portal Purchased Product Pickup and Reports
- Discount Options
- PAX Credit Card Reader Setup
- Show all articles ( 3 ) Collapse Articles
-
- Upload Students (Video)
- Upload Students
- Upload Student Pictures
- Student Type
- Student Spirit Points
- Student Credit
- Upload Student Credit
- Managing Student Credit
- Student Credit - Credit Refunds
- Manage Spirit Points
- Mass Updates
- Discount Options
- Manage Students
- Family and Guest Management
- Manage Family and Guests
-
- Accessing the Open Store Portal
- Accessing the Student Only Store Portal
- Family and Guest Management
- Configure your Portal and Products
- Portal Purchased Product Pickup and Reports
- Manage Family and Guests
- ProPay (Heartland) Merchant Account
- Google Single Sign-On (SSO)
- Family Portal
- Microsoft Single Sign-On (SSO)
-
- User Accounts
- Upload User Accounts
- User Permissions
- Taxes
- Paysafe: PCI Compliance
- Cash Drawer (Connected to Thermal Printer)
- Cash Drawer (USB) Windows 10
- Product History (Link on Current Transaction)
- Product Agreement
- Accessing the Student Only Store Portal
- Configure your Portal and Products
- Portal Purchased Product Pickup and Reports
- My Account
- SFTP Automated Student Rosters
- Accessing the Open Store Portal
- ProPay (Heartland) Merchant Account
- School Logo
- PAX Credit Card Reader Setup
- Whitelist URL's
- Show all articles ( 4 ) Collapse Articles
-
- System Settings Getting Started (Video)
- User Accounts
- User Permissions
- Upload User Accounts
- Upload Student Pictures
- Remote Support
- Mass Updates
- ProPay (Heartland) Merchant Account
- School Logo
- Google Single Sign-On (SSO)
- PAX Credit Card Reader Setup
- Preparing for Next School Year
- Microsoft Single Sign-On (SSO)
-
Voting
-
- Adding an Election
- Adding Officer Positions
- Adding Candidates
- Election Preflight
- Removing Candidates
- Adding Pictures and Biographies
- Archive and Retrieve Old Elections
- Duplicate an Election
- Using Video Biographies
- Election Layout Options
- Preview an Election
- Write-in Candidates
- Create a Survey (Video)
-
- User Accounts
- User Permissions
- Upload User Accounts
- Configure the Student Login Page
- Require Student E-mail
- Notifications for Unsuccessful Student Login Attempts
- Hobbies and Biography
- My Account
- Require Change Passwords
- SFTP Automated Student Rosters
- Google Single Sign-On (SSO)
- School Logo
- Whitelist URL's
-
Ticketing
-
Interventions
-
- Articles coming soon
-
- User Accounts
- Upload User Accounts
- User Permissions
- Printer Setup - 3" Thermal (Windows)
- Printer Setup - 3" Thermal (Mac) **Advanced Setup**
- Printer Setup - 3" Thermal Network (Mac) **Advanced Setup**
- Interventions
- Bell Schedules
- My Account
- SFTP Automated Student Rosters
- School Logo
- Mass Updates
- Whitelist URL's
-
Announcements
-
Student / Family Portal
-
Digital ID
Financial Reports
In this article, you will learn about using the financial reports.
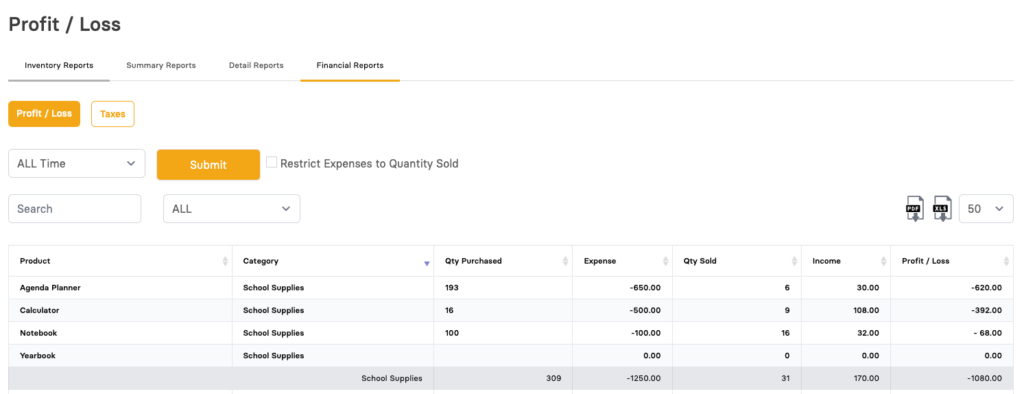
Profit / Loss
-
By default, Profit / Loss tab is selected. You can also navigate to Taxes reports. Read below for more details.
-
By default “All Time” is selected, but you can change the date range to restrict sales to a specific range.
-
You can download the search results in Excel spreadsheet or PDF format by clicking on the icon respectively.
-
Use the Search box to find a specific product or use the filter to narrow down to a single category. The headers are also sortable.
To access, click on the Reports button available at the top bar and select the tab for Financial Reports.
The report as shown above will calculate what was purchased and what was sold during the time frame selected. So if you spent $1,250 on items during that time frame it will show $1,250 as a total expense not the expense of the items that you sold.
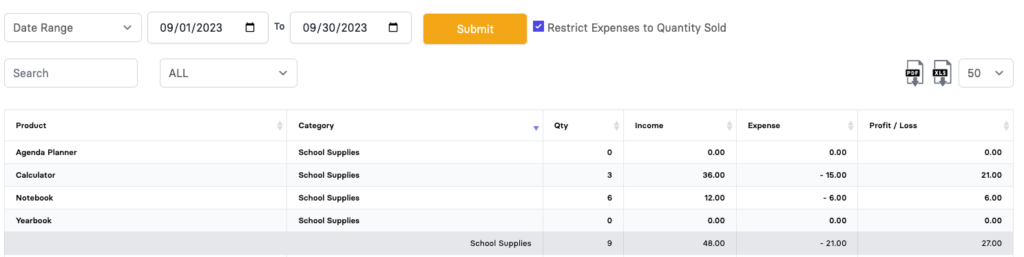
Profit / Loss (Restrict Expenses to Quantity Sold)
-
When “Restrict Expenses to Quantity Sold” is selected
-
Quantity will be the driver of this report
The report as shown above with "Restrict Expenses to Quantity Sold" checked, will calculate based on how many items were sold during that timeframe. So if you bought 50 items, but only sold 6, this version of the report will take the cost per unit of the last time each item was purchased and multiple that times the quantity sold to get the total expenses.
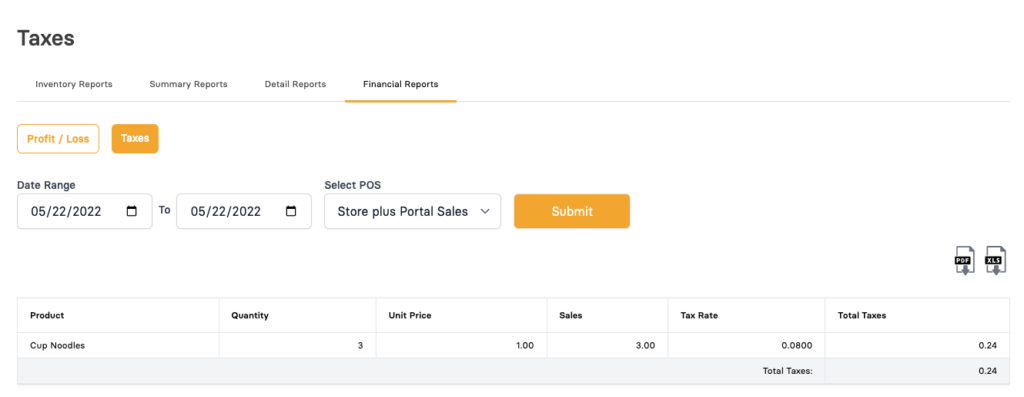
Taxes
-
Select the tab for Taxes.
-
Specify the search criteria such as Date Range and POS. Click on the Submit button to retrieve the results.
-
This report will break down by product taxes that were collected. If you are not collecting taxes, you will not need to run this report.